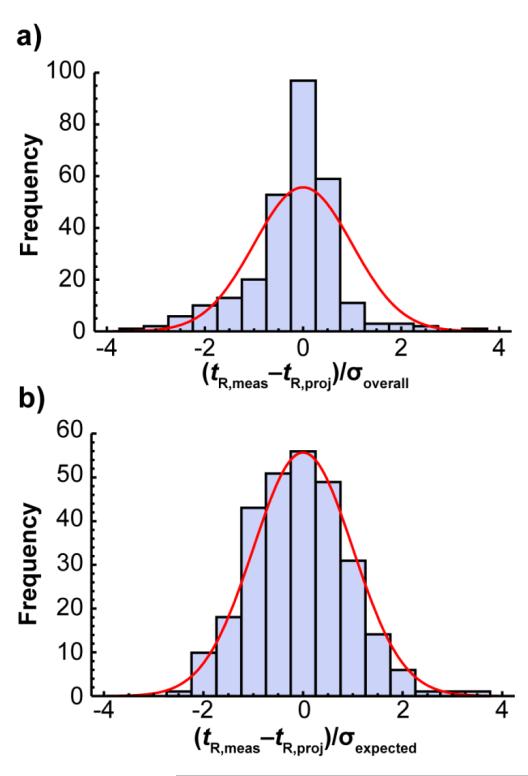
Figure 3.
Probability distributions of the error, tR,meas-tR,proj, in 282 retention projections divided by a) the overall standard deviation, σoverall, and b) divided by the calculated standard deviation expected for each compound in each method, σexpected. The red line shows the best fit normal distribution.

