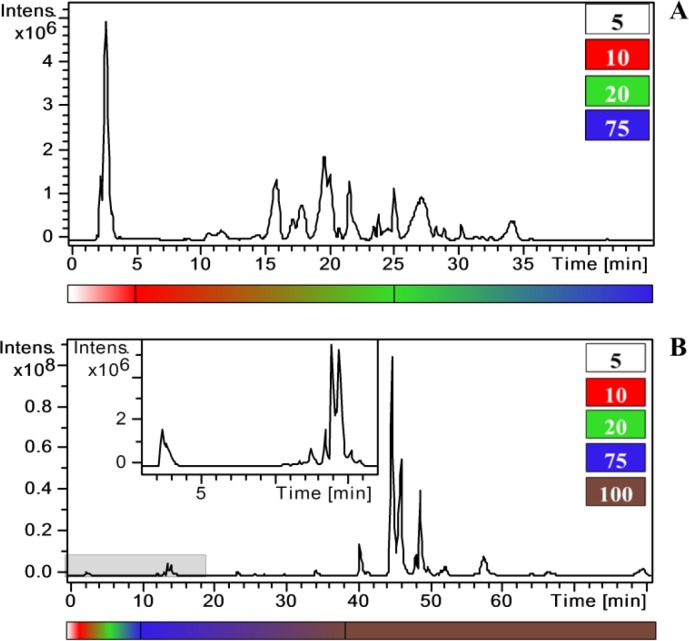
Figure 1.
Two examples of LC-MS analysis, showing chromatograms representing two different matrices obtained using different ion sources. The x-axis shows the time in minutes and the y-axis shows the relative signal intensity. The underlying bars represent the chromatographic elution patterns which start at 5% (white) and increase to 75% (blue) or 100% (brown) of acetonitrile. In the chromatograms, polar compounds elute first, followed semi-polar and non-polar compounds. A: LC-ESI-MS/MS chromatogram of a grape berry methanolic extract. B: LC-APCI-MS/MS chromatogram of an Arabidopsis thaliana methanolic extract.

