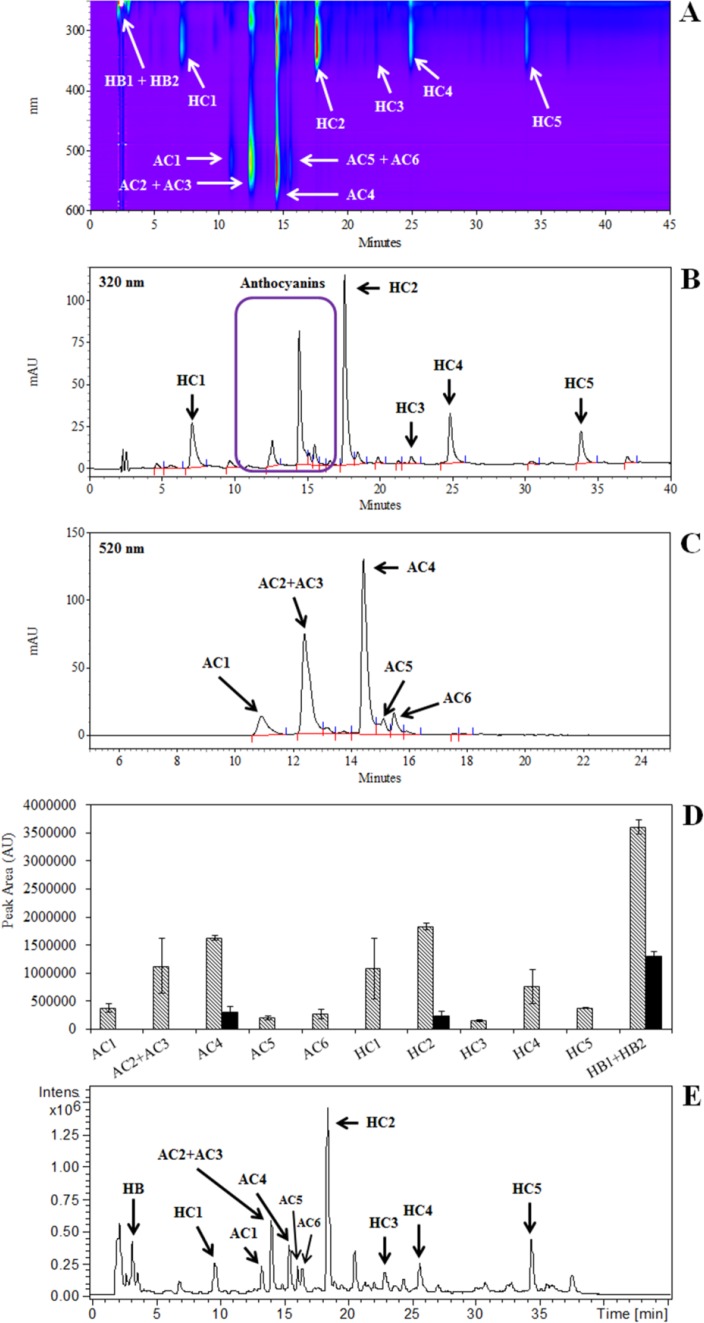
Figure 3.
R3M carrot cell suspension extract analyzed by HPLC-DAD and HPLC-ESI-MS.
A: Absorbance (245–600 nm) expressed in Arbitrary Units (mAU) using a scale is set from a minimum level of absorbance (-10 mAU) shown in purple, to a maximum (+100 mAU) shown in red. B: Chromatogram at 320 nm. C: Chromatogram at 520 nm. The peaks were characterized by LC-MS as follows. AC1: Cyanidin hexosyl pentosyl hexoside and cyanidin hexosyl pentoside. AC2 + AC3: Cyanidin caffeoyl hexosyl hexosyl hexoside and cyanidin caffeoyl hexosyl pentosyl hexoside. AC4: Cyanidin sinapoyl hexosyl pentosyl hexoside. AC5: Cyanidin feruloyl hexosyl pentosyl hexoside. AC6: Cyanidin coumaoryl hexosyl pentosyl hexoside. HC1: Caffeoyl quinic acid. HC2: Caffeoyl methyl quinic acid. HC3: Dicaffeoyl quinic acid. HC4: Caffeoyl methyl quinic acid and Caffeoyl dimethyl quinic acid. HB1 and HB2: Unknown compounds with absorbance spectra similar to hydroxybenzoic acids. D: Quantification of the 11 major peaks detected by LC-DAD. Black and white columns represent cells cultivated in constant darkness and under constant illumination, respectively. The values are the average of three independent biological replicates. E: LC-ESI-MS analysis of cells cultivated under constant illumination. Several peaks, which are not detected by LC-DAD, are also present in the chromatogram.

