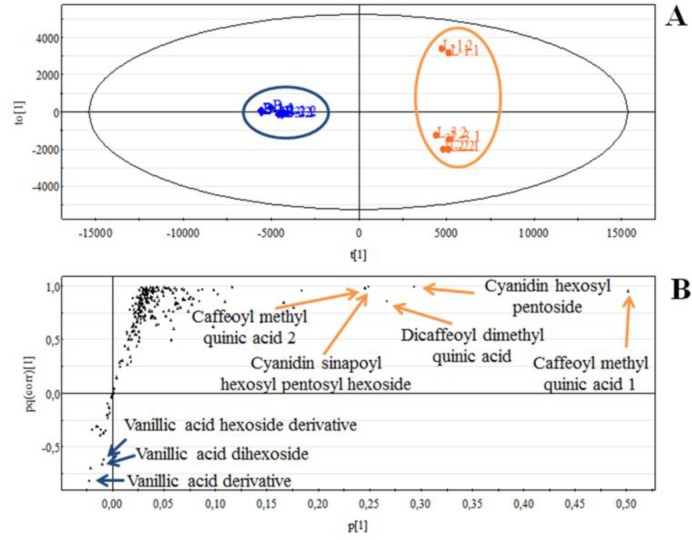
Figure 4.
A: Score scatter plot of R3M carrot suspension cell cultures obtained by OPLS-DA of 218 metabolites quantified by LC-MS. Each symbol represents a single chromatography experiment, with cells grown under illumination shown in orange and those grown in the dark shown in blue. The analysis was carried out using three independent biological replicates for each treatment (i.e. L1, L2, L3 = cells cultivated in the light; B1, B2, B3 = cells cultivated in the dark) and two independent technical replicates for each biological replicate (i.e. L1.1, L1.2 are the technical replicates of biological replicate 1). B: S-plot of R3M carrot suspension cells cultivated in the light and in the dark, obtained by mapping p against pq(corr) in OPLS-DA. Each point represents a compound detected and quantified by LC-MS. p is an indicator of the “weight” of each molecule in the model, which directly depends on its abundance; pq(corr) indicates the ability of a compound to distinguish the dark and light samples (two classes).

