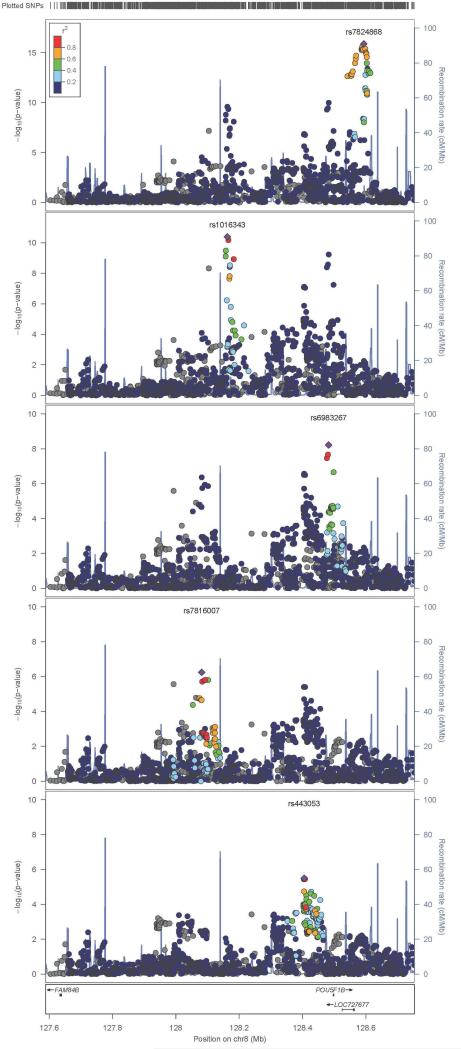
FIGURE 5.
LocusZoom plots of well-imputed variants from the 8q24 locus. Each panel shows statistically independent regions at the locus in order of statistical significance in our data. Color coding indicates the local pairwise linkage disequilibrium with our most significant variant in the region. Displayed –log10(p-values) are for overall association statistics with prostate cancer risk.

