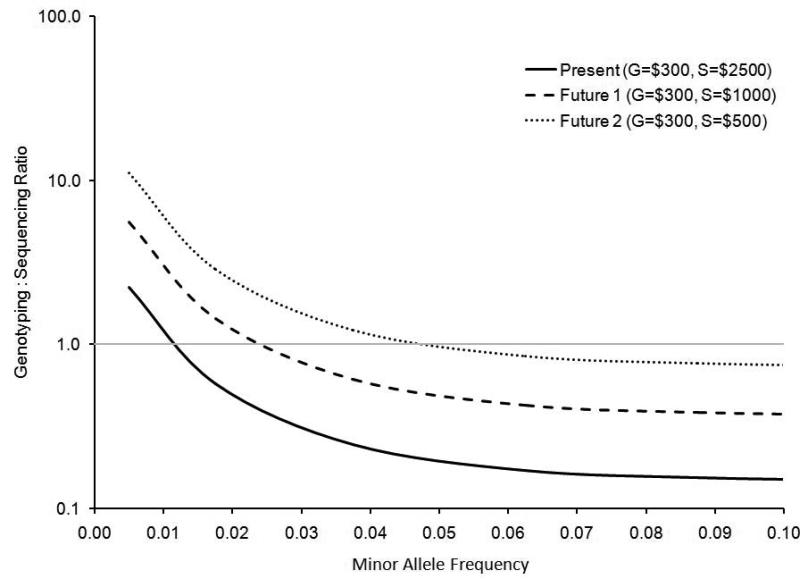
FIGURE 7.
Comparison of the cost effectiveness of achieving 80% power by performing genotyping plus imputation to the cost effectiveness of sequencing. Above calculations are for a hypothetical disease with prevalence 10%, per allele relative risk of 1.3, and alpha of 5×10⁻⁸. A genotyping to sequencing ratio greater than one indicates a scenario where it is more cost effective to sequence. Three scenarios of relative pricing are considered. The genotyping to sequencing ratio is plotted on a logarithmic scale.

