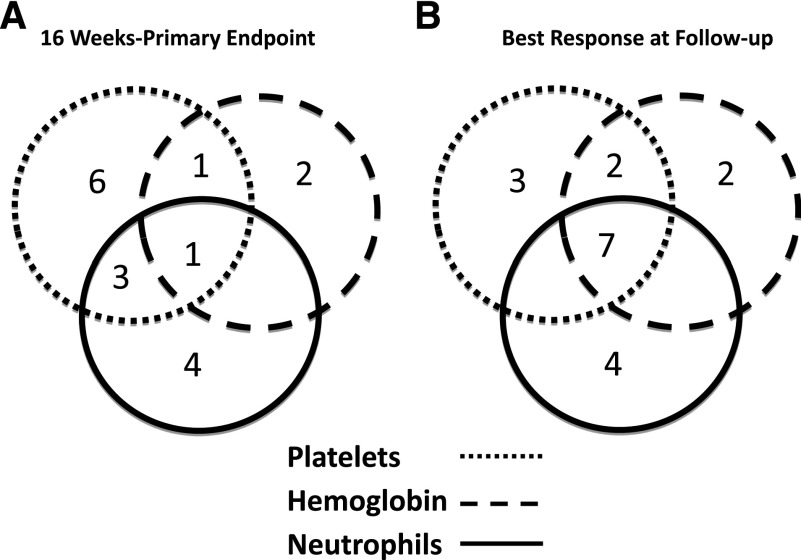
Figure 1.
Responses to eltrombopag by lineage. These Venn diagrams show the numbers of patients with uni- and multilineage responses at response assessment (A) and best response at follow-up (B). All biological best responses are included in panel B, including a >1.5 g increase in hemoglobin, even if it began at >9 g/dL. The lineage affected is indicated by the shade of the circle.

