
Figure 1.
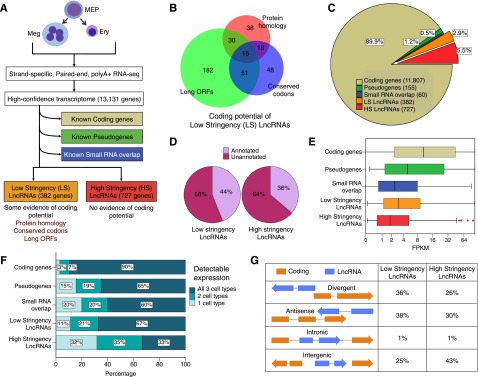
Identification and characterization of mouse erythro-megakaryocytic lncRNAs. (A) Bioinformatic pipeline for identification of lncRNAs. See “Materials and methods” for details. (B) Venn diagram showing protein coding potential of low-stringency lncRNAs as assessed by 3 different bioinformatic tools. Note that bioinformatic tools, even after calibration with test datasets (supplemental Figure 1C), show limited correlation with each other in determining coding potential. (C) Pie chart showing composition of the mouse erythro-megakaryocytic polyA+ transcriptome; 8.4% of genes are candidate lncRNA genes (low + high stringency). (D) Most erythromegakaryocytic lncRNAs are not annotated in RefSeq, UCSC, or Ensembl datasets. (E) Expression measured as FPKM for gene categories. LncRNA genes have overall lower expression than coding genes. (F) Cell specificity of RNAs according to type. Note that approximately one-third of high-stringency lncRNAs are detectable in only 1 of the cell types indicated at the top of panel A, as compared with 90% of coding genes, most of which are detectable in all 3 types. (G) Percentage of lncRNA genes in orientations relative to nearby coding genes. ORF, open reading frame.