Figure 6.
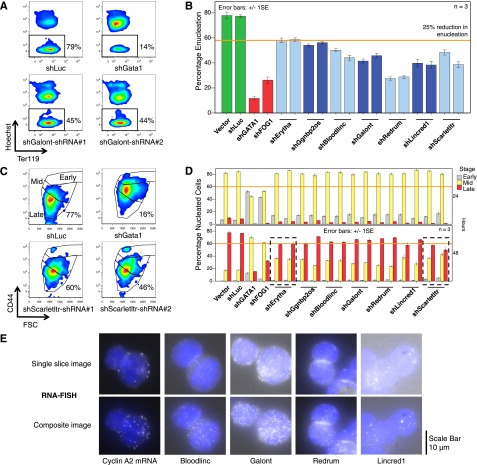
RNAi of multiple mouse lncRNA genes inhibits erythroblast maturation. (A) Mouse fetal liver erythroid progenitors were infected with retroviruses encoding shRNAs against lncRNAs, cultured for 48 hours in an expansion medium to maintain the immature state, and then switched to a medium that facilitates terminal maturation. Representative flow cytometry plots quantifying the proportion of anucleate reticulocytes (black rectangles) after 48 hours of maturation are shown. Hoechst 33342 is a cell permeable nuclear dye. Ter119 is an erythroid maturation marker. (B) Summary of multiple experiments showing percentage of reticulocytes in shRNA-expressing erythroid cultures after 48 hours of maturation, performed as shown in panel A. Vector-only and shLuciferase shRNAs are negative controls; shGATA1 and shFOG1 shRNAs are positive controls used to suppress expression of the essential erythroid TFs. The results of 2 different shRNAs used to knockdown each candidate are shown as pairs of bars for each lncRNA. n = 3 biological replicates. (C) Representative flow cytometry plots assessing the maturation stages of nucleated (Hoechsthigh) erythroblasts at 48 hours of maturation, using the immature erythroblast marker CD44 and forward scatter (FSC), which reflects cell size. Gates (from highest to lowest) mark early-, middle-, and late-stage erythroblasts; the percentage of cells in the late stage gate is listed. (D) Summary of multiple experiments showing maturation stage distribution of nucleated erythroblasts in shRNA-expressing erythroid cultures at 24 and 48 hours, performed as shown in panel C. Knockdown of 2 lncRNAs (Erytha and Scarletltr, dotted black rectangles) reduced the proportion of mature erythroblasts by >25% at 48 hours by 2 different shRNAs. n = 3 biological replicates. (E) Single molecule RNA fluorescent in situ hybridization (FISH) on primary mouse fetal liver erythroblasts for Cyclin A2 mRNA and for lncRNAs Bloodlinc, Galont, Redrum, and Lincred1. Single-slice images depict subcellular localization; composite images depict overall lncRNA abundance. Each composite image represents a maximum projection of a stack of z-slices taken through the volume of the cell. The nucleus is labeled blue with 4,6 diamidino-2-phenylindole, and single RNA molecules are visible as white punctate spots.

