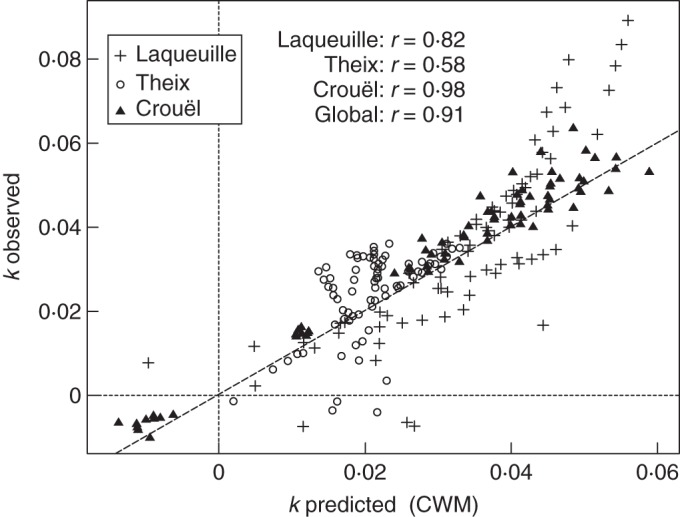
Fig. 3.

The observed decomposition rates (g g−1 week−1) of multispecies litter mixtures are plotted against the predicted decomposition rates based on monoculture decomposition rates weighted by relative abundance, for each site (CWM, in g g−1 week−1). The dashed line represents the 1:1 relationship, i.e. absence of deviation. Pearson's correlation coefficient (r) was calculated for each site and globally.
