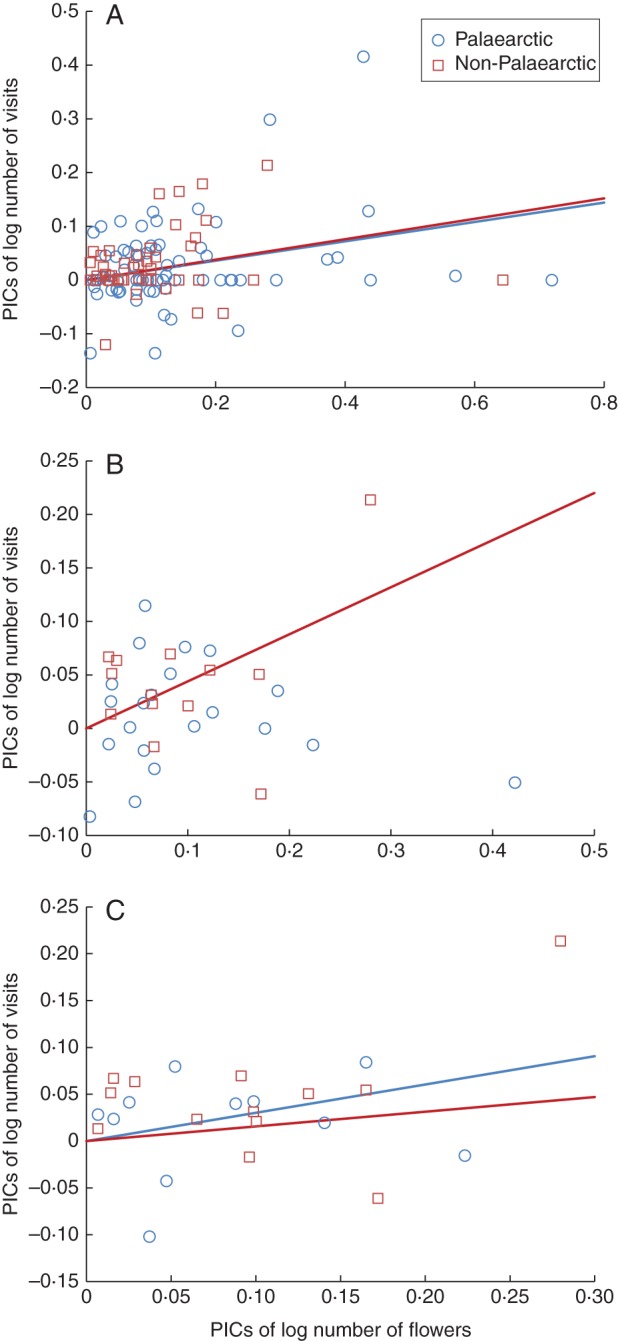
Fig. 1.

Relationship between the number of bumblebee visits (all five species combined) and the number of flowers available, expressed as phylogenetically independent contrasts (PICs) of log-transformed data, when (A) all 119 plant species with bee-visitation syndromes (B) 36 plant species with actual visits, and (C) only 26 horticultural (i.e., non-weed) plant species were included. Blue points and lines: PICs for plants of Palaearctic distribution and their least squares slope drawn through the origin, respectively; Red points and lines: PICs for plants from outside the Palaearctic Region and their least squares slope, respectively. Except for the relationship for Palaearctic plant species in (B), which was not significant (P > 0·05), and is thus omitted, all slopes were significantly different from zero (P > 0·01). The interaction term PICs of flower number × Region (Palearctic vs non-Palearctic), which tests slope differences between the two regions, had the following significance levels: (A) F1,114 = 0·071, P = 0·79; (B) F1,32 = 6·79, P = 0·014; (C) F1,21 = 0·60, P = 0·56). The proportion of variance accounted for by the covariate (PICs of flower number through the origin), plus separate slopes (Region × PICs of flower number) model was, respectively: (A) R2adj = 0·15; (B) R2adj = 0·23; (C) R2adj = 0·28. All three models were significant at P≤0·01.
