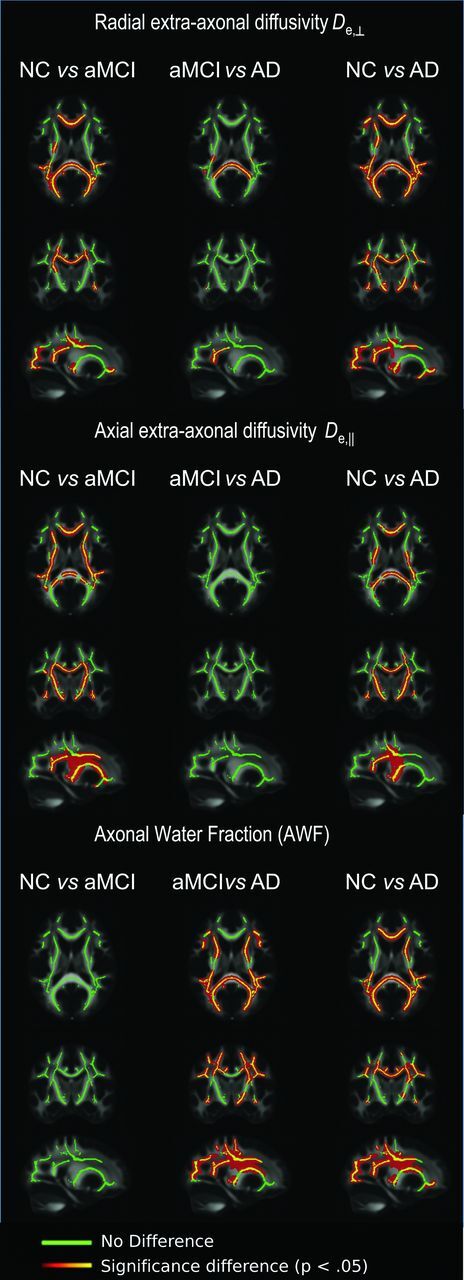
Fig 2.

TBSS results showing all 3 group comparisons for WMTI metrics of radial extra-axonal diffusivity, axial extra-axonal diffusivity, and axonal water fraction: Clusters of significantly different voxels (P < .05) are shown in red-orange and overlaid on the FMRIB FA template, together with the mean skeleton (green). Clusters of increased radial extra-axonal diffusivity are found both for NC versus MCI groups and for MCI versus AD groups. Clusters of increased axial extra-axonal diffusivity are found for NC versus MCI groups, and clusters of decreased AWF are observed for MCI versus AD groups.
