
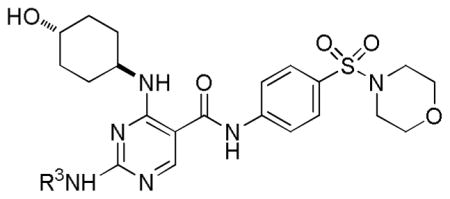
Table 4.
SAR Study of R3
| ||||
|---|---|---|---|---|
| Compound | NHR3 | IC50 (μM)a
|
||
| Mer | Axl | Tyro3 | ||
| 34 |
|
2.4 | 16.6 | >30 |
| 35 |

|
0.15 | 1.2 | >30 |
| 36 |

|
0.037 | 0.78 | 16.2 |
| 37 |
|
0.011 | 0.61 | 1.2 |
| 38 |
|
0.027 | 1.1 | 21.9 |
| 39 |
|
0.0073 | 0.30 | 0.94 |
| 40 |
|
0.086 | 5.7 | 5.1 |
| 41 |
|
0.059 | 4.3 | 6.7 |
| 42 |

|
0.024 | 1.9 | 1.7 |
| 43 |

|
0.047 | 9.0 | 4.3 |
| 44 |

|
0.18 | 7.4 | 2.3 |
| 45 |
|
0.12 | >30 | >30 |
| 46 |

|
>30 | >30 | >30 |
| 47 |

|
>30 | >30 | >30 |
a
Values are the mean of two or more independent assays.