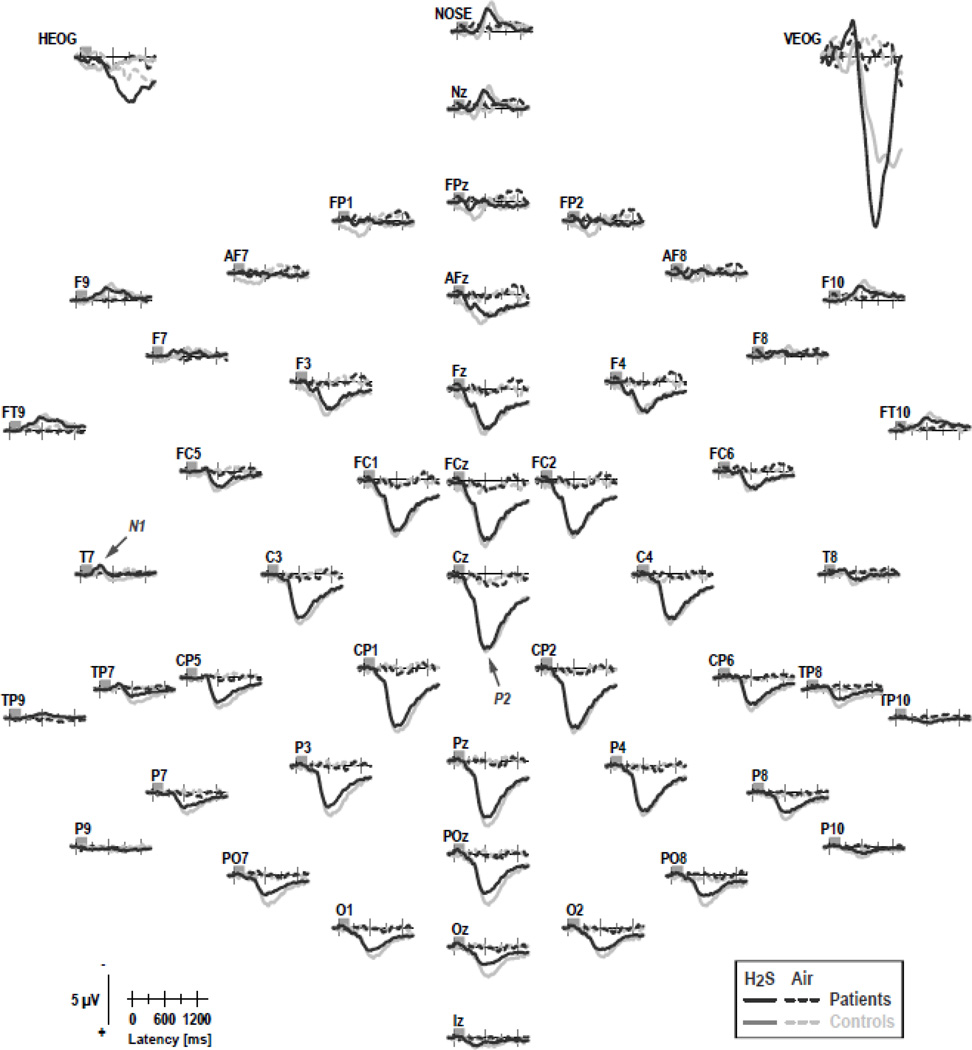
Figure 3.
Grand mean olfactory ERP [µV] waveforms (−100 to 1400 ms, 100 ms pre-stimulus baseline) referenced to linked mastoids of CHR patients and healthy controls for H2S stimuli (pooled across intensity) and blank air at all 49 recording sites. Horizontal and vertical electrooculograms (EOG) are shown before blink correction. Two prominent ERP components identified in previous studies are labeled at sites T7 (N1) and Cz (P2).

