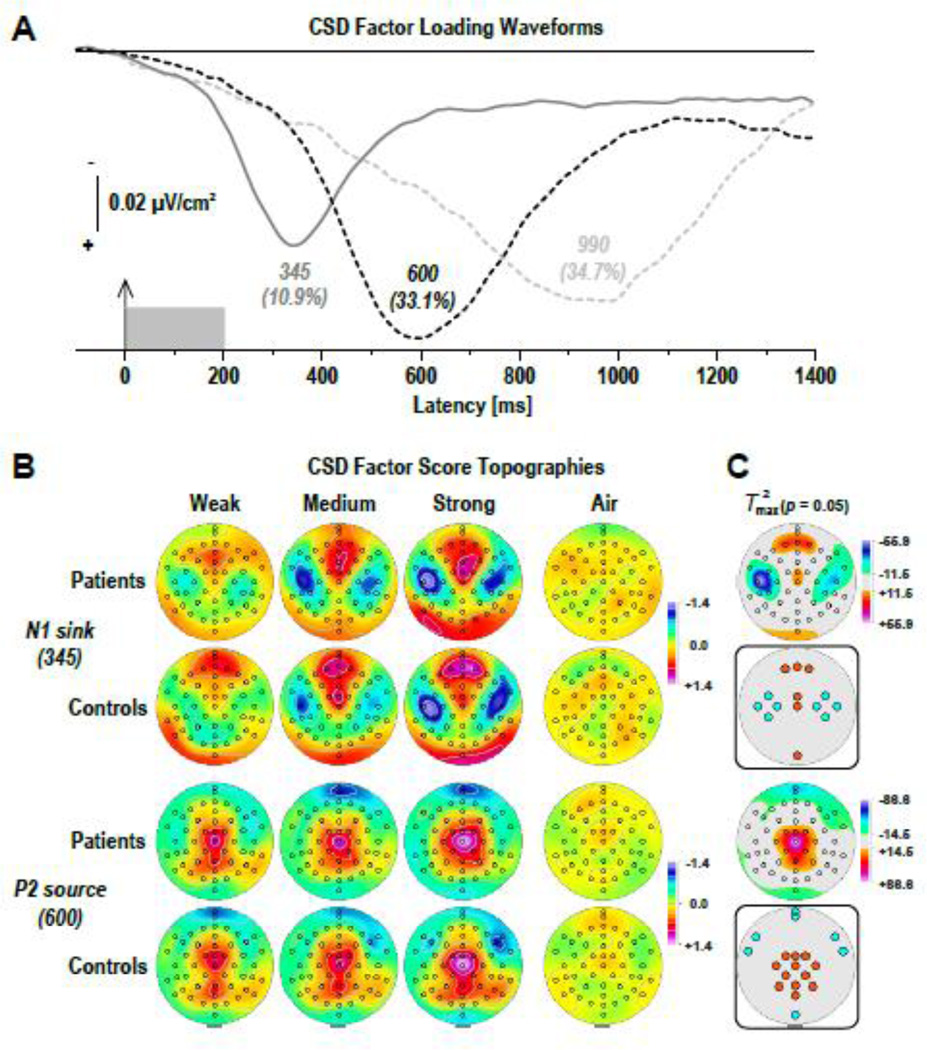
Figure 6.
(A) Factor loadings of the first three PCA factors (with explained variance) extracted from olfactory CSD waveforms (N = 41). (B) CSD factor score topographies corresponding to N1 sink (top) and P2 source (bottom) for 21 CHR patients and 20 healthy controls comparing H2S stimuli of weak, medium, and strong intensity and blank air. (C) Squared univariate (channel-specific) paired samples T statistics thresholded at the 95th quantile (p = 0.05) of the corresponding randomization distribution (maximum of all 49-channel squared univariate paired samples T statistics) of difference between H2S stimuli (pooled across intensity) and blank air (N = 41). To facilitate comparisons of the max(T2) topographies with the underlying sink-source difference topographies, the sign of the difference at each site was applied to the respective T2 value, which is otherwise always positive. Inset topographies show the sites selected for repeated measures ANOVA models performed on CSD factors 345 (N1 sink) and 600 (P2 source) to probe region-specific sink (cyan) or source (orange) activations associated with odor detection, as indicated by colored locations. All topographies are two-dimensional representations of spherical spline interpolations (m = 2; λ = 0) derived from the mean factors scores or T2 statistics available for each recording site.

