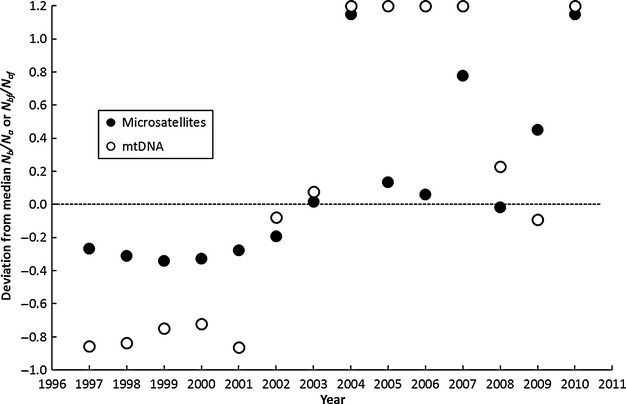
Figure 4.

Deviations of observed and median Ñb/Na or Ñbf/Naf plotted by time. The dashed line indicates null expectation, that is, that observed and median values are identical. Two combined estimators (using the method of Waples and Do 2010, appendix A) are depicted (for simplicity), and both show significant departure from a random sequence of ratios across time (with 4 runs, 7 observations below and 7 above the median, P < 0.035 in both cases). Ratios greater than 1 were included runs tests, but are depicted on the figure at an arbitrary maximum value of 1.2 to simplify presentation. Observed values are always below the median prior to 2003, and nearly always above the median value later in the time series.
