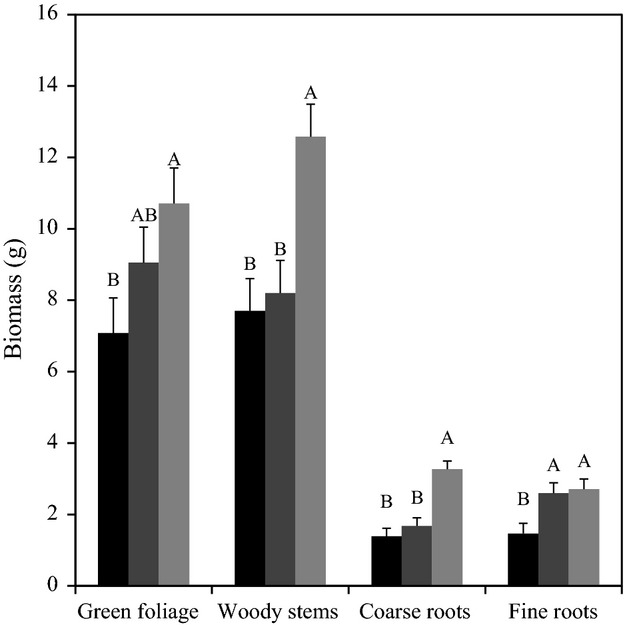
Figure 2.

LS mean biomass ± SE of four plant tissue groups for three defoliation treatments. Chemical: black bars; herbivore: dark gray bars; control: light gray bars. Different letters correspond to differences between means within a plant tissue category (Student's t-test, α = 0.05). Defoliation treatments were applied in the summer of 2010, and plant parts were harvested, dried, and weighed the following spring. Mean percent canopy defoliation was 64%, 35%, and 7.5% for chemical, herbivore, and control treatments, respectively.
