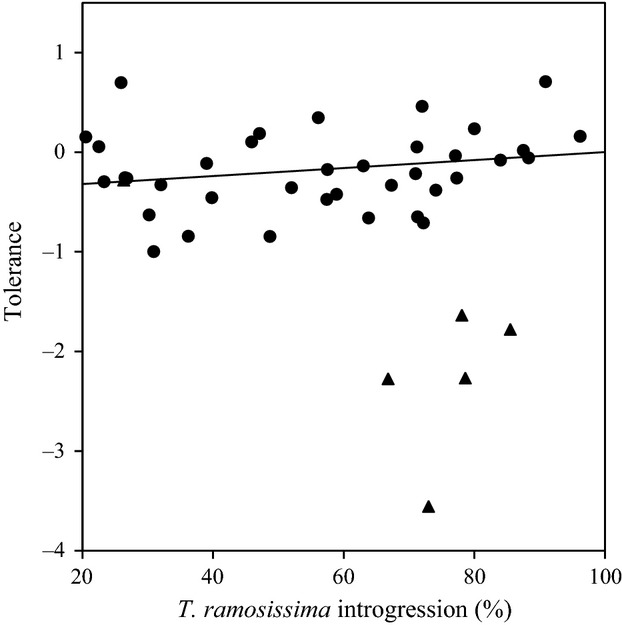
Figure 3.

Tolerance to defoliation across species introgression for plant genotypes in the experiment. Positive tolerance values correspond to plant overcompensation, while negative values correspond to plant undercompensation to defoliation. Tolerance demonstrated a positive relationship with introgression when the SEs of tolerance scores were included in a weighted regression (tolerance = 0.004*introgression – 0.40; R2 = 0.13). Weighted regression was used because some clones in the chemical treatment died, thus leading to more error for those particular genotypes (triangles). See Appendix S2 for detailed tolerance scores of each genotype.
