Figure 1.
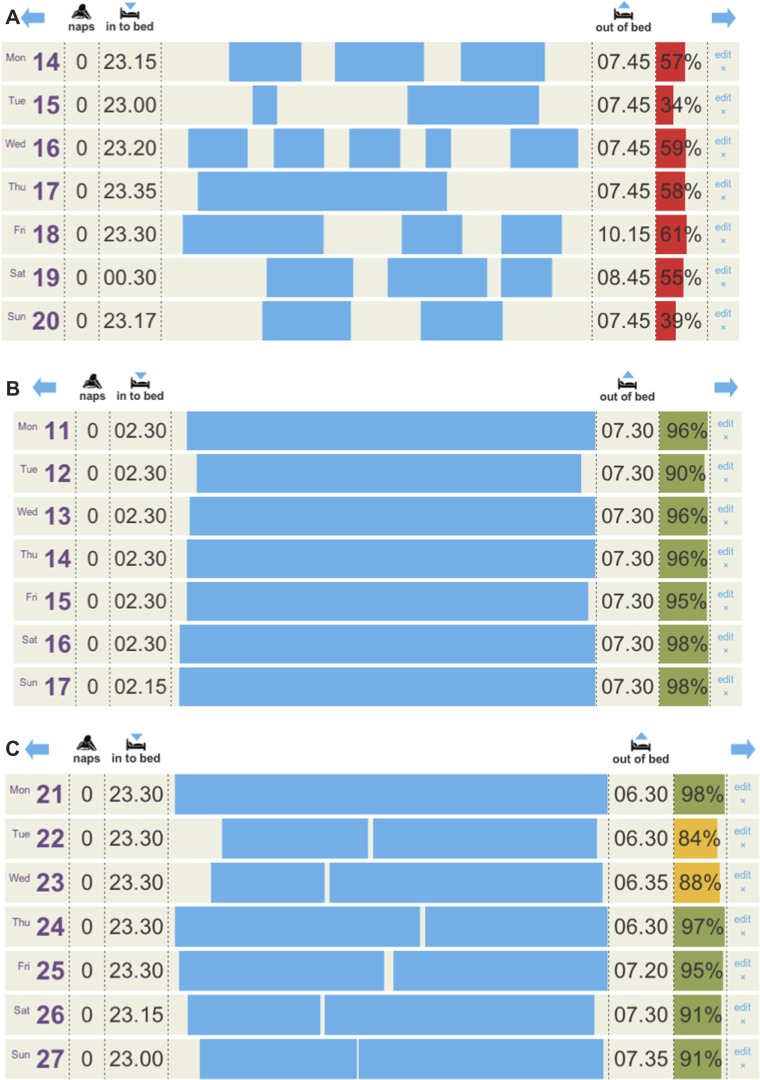
Three sleep diaries are shown, the data were entered by the participants, and the sleep efficiency was automatically calculated based on time into bed and reported time asleep. The day, date, and any daytime naps are also shown. Sleep efficiency below 80% is shown in red, below 90% is shown in yellow, and above 90% is shown in green.
Notes: (A) Shows the second week of initial sleep diaries; (B) shows the period of sleep restriction where the participant has been instructed to keep time into bed to between 02.30 and 07.30; (C) shows the diary upon completion of 6 weeks of therapy.

