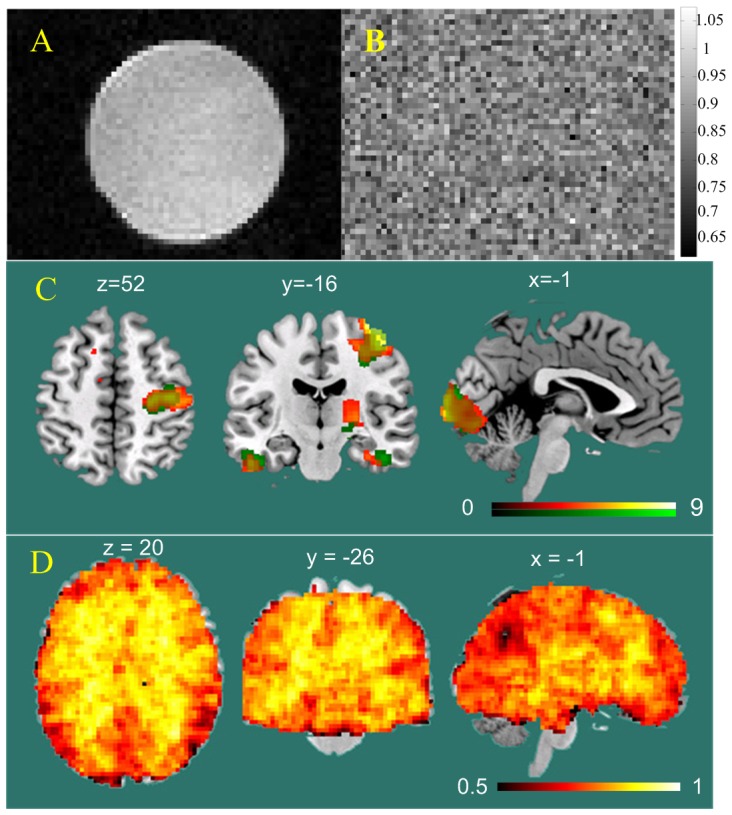
Figure 1. Evaluations of entropy mapping using fMRI.

A) image of a cylinder water phantom; B) entropy map of the phantom. The color bar indicates the display color window for the entropy map; C) visual and sensorimotor functional activation induced brain entropy decrease as compared to the resting state. Red and green represent the test (session 1) and retest (session 2) experiment, respectively. The color bars indicate the color window used to display the statistical comparison results (t maps of the paired student t-testing). The statistical threshold for identifying the entropy decreasing clusters is p<0.001 and cluster size>30 (uncorrected for multiple comparisons); D) the correlation coefficient (CC) map of 50 subjects' resting BEN maps. The color bar was used to map the CC value from 0.5 to 1.
