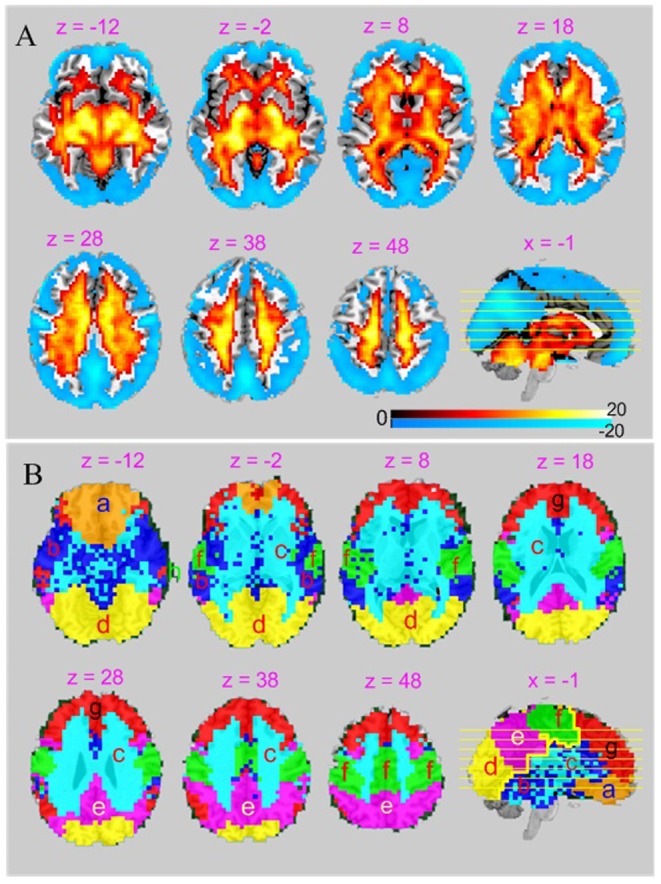
Figure 3. Spatial distribution and regional organization of BEN.

A) The statistically defined higher-than-average BEN network (hot color) and lower-than-average BEN network (cool color). The significance level used for thresholding the distribution map (the statistical parametric map of the student t-test) is p<0.01 (corrected for multiple comparison); B) The 8 BEN clusters identified by clustering: a) OFC, b) TPLS, c) WM, d) VIS, e) DMN, f) MC, g) PFC, h) peripheral artifact. The text above each axial slice in B, C, and D indicates the slice location (z and x mean the x and z coordinate in mm, respectively) in the MNI space. The left side of image corresponds to the left side of brain.
