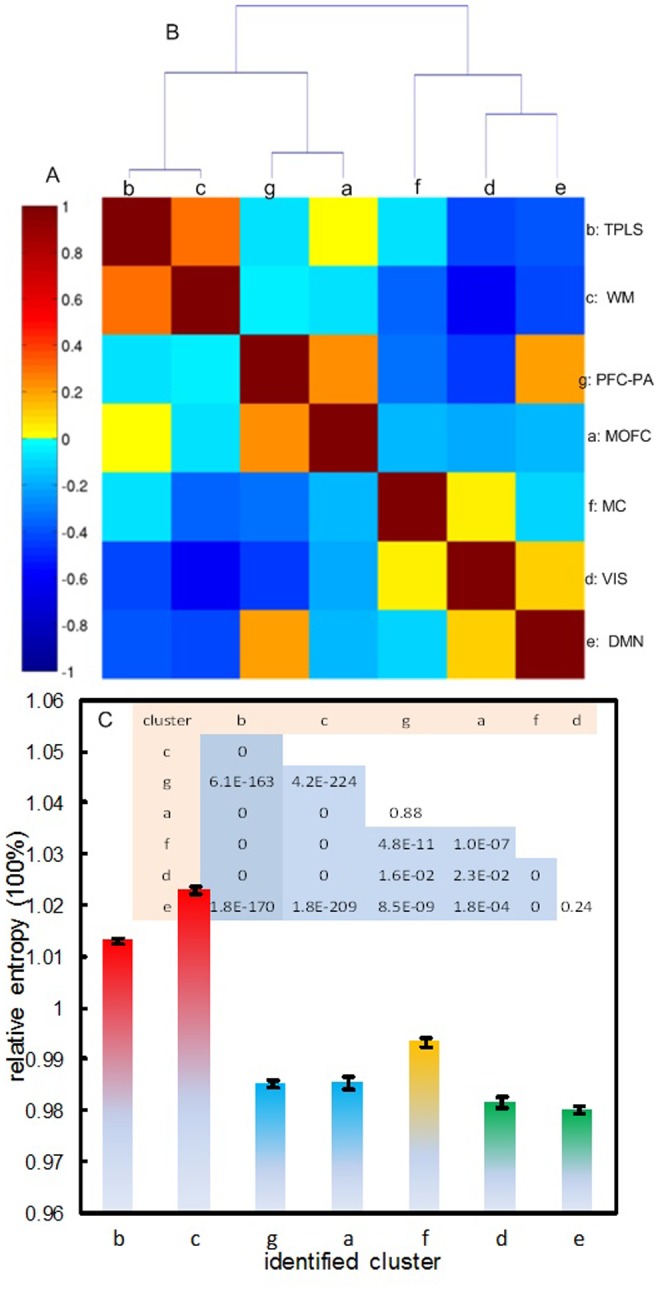
Figure 4. The hierachy and ranking of the BEN-derived brain subdivisions.

A) the across-subject BEN similarity matrix, B) the hierarchical structure of the 7 BEN clusters. C) Mean and standard errors of the mean rBEN in the 7 clusters. The color map in A represents the correlations of BEN within and between BEN clusters. The inset in C lists the probability of the rBEN comparisons between a pair of BEN clusters.
