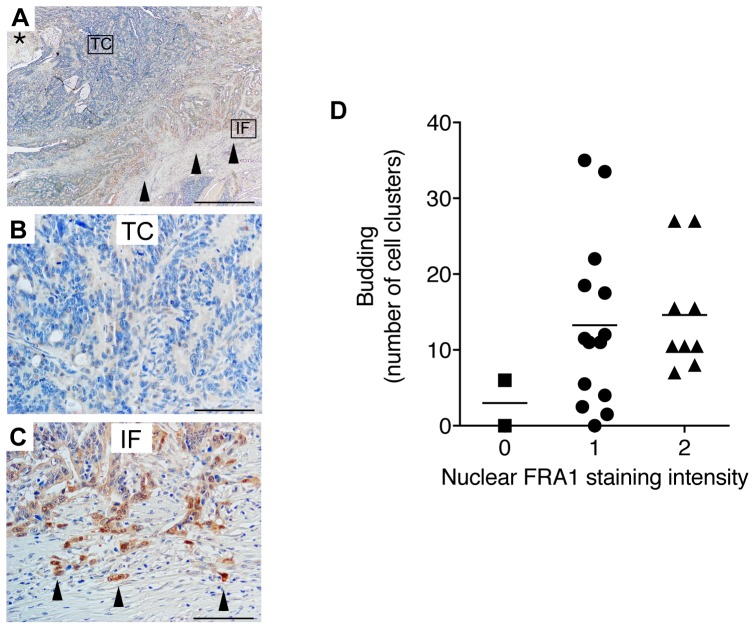
Figure 1. Enrichment of FRA1 in tumor cells at the invasive front of human CRCs.
(A) Low power image of a representative colorectal carcinoma stained with an antibody detecting FRA1. The asterisk indicates the lumen, while the arrowheads indicate the deep invasive front. Scale bar represents 1 mm. (B and C) High power images of the tumor centre (TC) and invasive front (IF) shown in (A). Arrowheads indicate tumor buds. Scale bar represents 10 µM. (D) Relationship between the intensity of nuclear FRA1 expression and the tumor budding marker, cytokeratin AE1/AE3 in 25 CRC cases.

