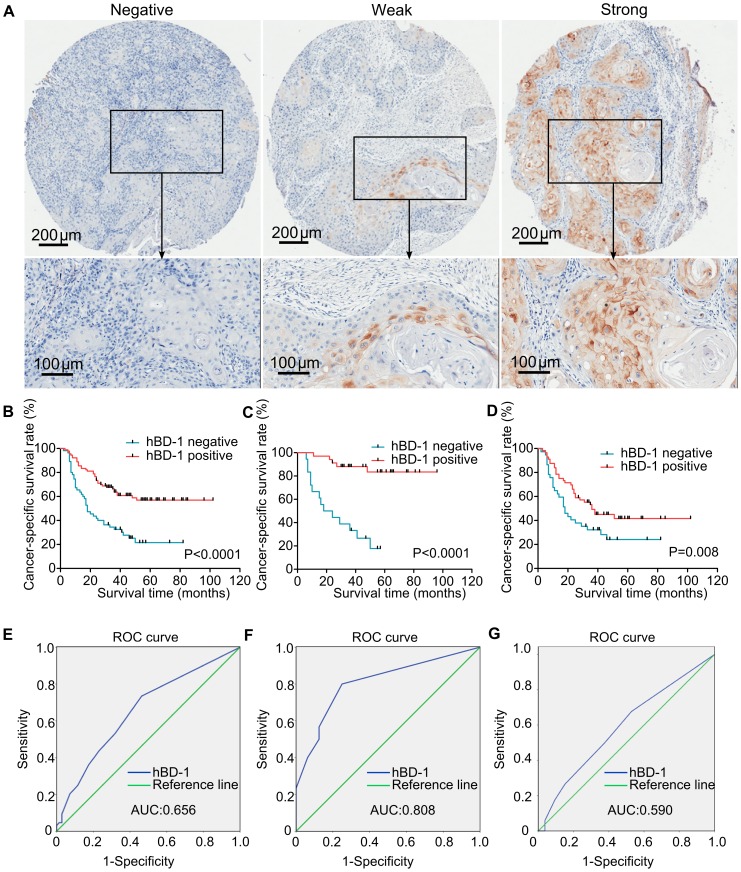
Figure 5. Association of hBD-1 expression with prognosis of OSCC.
A) Examples of negative, weak and strong staining of hBD-1 protein in tissue core from the tissue microarray. The lower panels displayed a magnified vision of the area in the corresponding black box. B–D) Kaplan-Meier analysis displayed cancer-specific survival time of patients with OSCC, and hBD-1 expression was associated with higher survival rate in all OSCC patients (B) as well as subsets of patients with stage I–II OSCC (C) and stage III–IV OSCC (D). E–G) ROC curve analysis of hBD-1 expression as a predictor for 3-year survival of all patients with OSCC (E), patients with stage I–II OSCC (F) and patients with stage III–IV OSCC (G). An area under the ROC curve (AUC) of 0.7–0.9 is considered excellent discrimination, whereas an AUC of 0.5–0.7 is considered moderate discrimination. The ROC curve showed that hBD-1 expression had excellent discrimination for the prediction of 3-year survival in patients with early stage OSCC (stage I–II).

