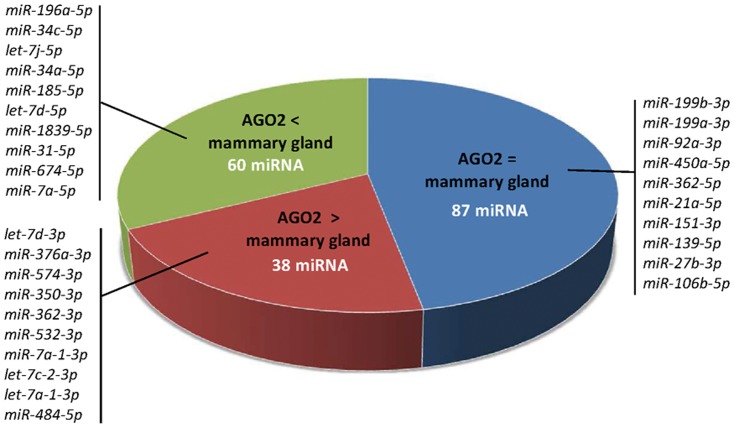
Figure 3. Characterisation of mouse AGO2-RISC loading.
Proportion of miRNA expressed with an equivalent ( = ) or a different (> or <) abundance in AGO2-RISC and mammary gland miRNomes. A few representative examples are presented for each category and the complete data are listed in Table S5.

