
Figure 1. The relative expression of Ets-1.
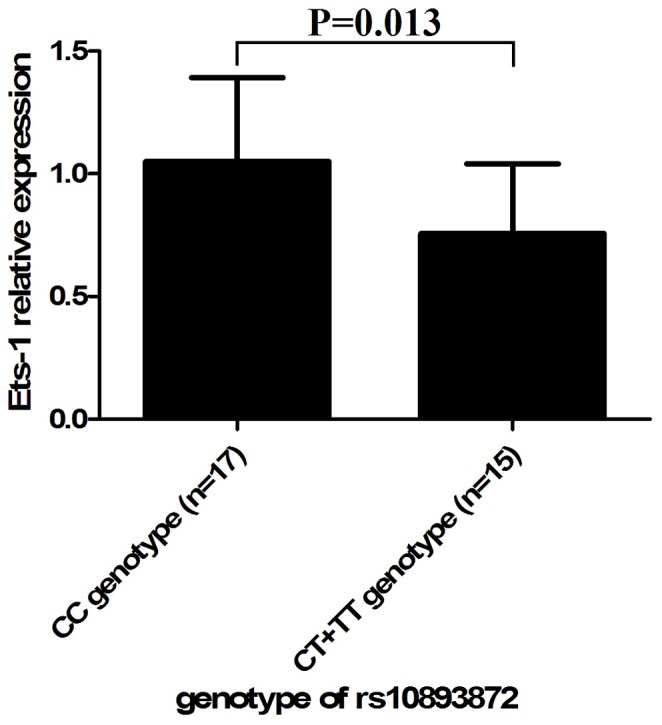
Ets-1 expression with three different genotypes of single nucleotide polymorphism (SNP) rs10893872 in peripheral blood mononuclear cells obtained from genotyped healthy controls (PBMCs). Real-time PCR analysis of Ets-1 expression in PBMCs derived from healthy individuals of SNP rs10893872 CC, CT and TT genotypes. The y axis represents relative Ets-1 expression level by real-time PCR of each genotype of SNP rs10893872. Data are shown as mean±SD.