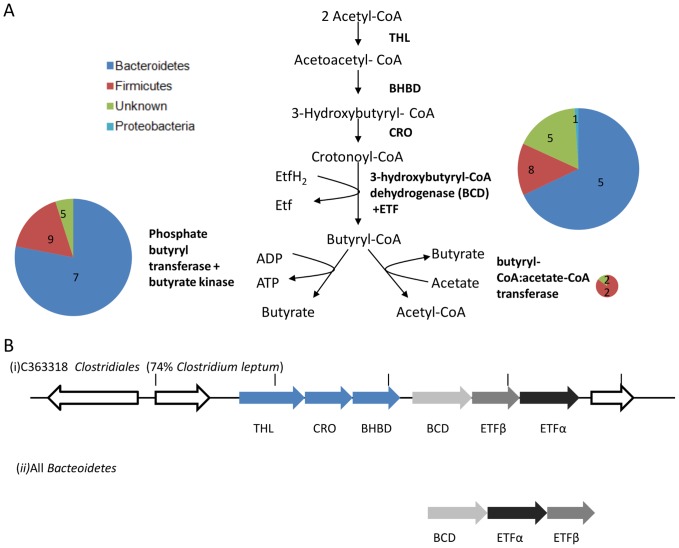
Figure 5. Pathways and gene clusters associated with butyrate production in the chicken cecal metagenome.
(A) Pathways involved in butyrate production showing the putative genes identified coding for the enzymes involved. Size of pie chart reflects abundance of the gene class; numbers indicate quantity of genes assigned to each taxon. (B) Operon structure of two butyryl-CoA:acetate-CoA transferase (BCD) loci.

