
Figure 1. Severe fever with thrombocytopenia syndrome virus (SFTSV) RNA loads in blood.
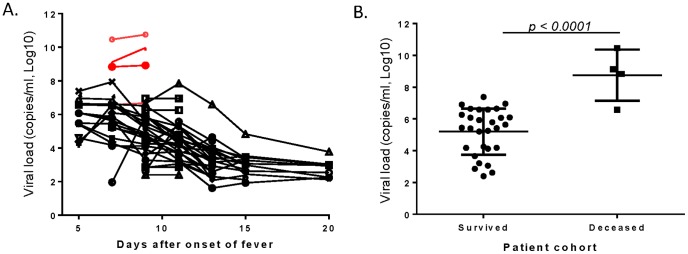
(A) The kinetics of viral RNA levels of individual patients between 5–15 days after onset of fever during hospitalization. Each curve represents one patient. The red curves indicate the deceased patients while the black curves represent the survivors. (B) The viral loads of the deceased patients and survivors as indicated on Day 9 after onset of fever. Each dot represents one patient. Statistical significance (p<0.0001) of viral loads between deceased patients and survivors is indicated.