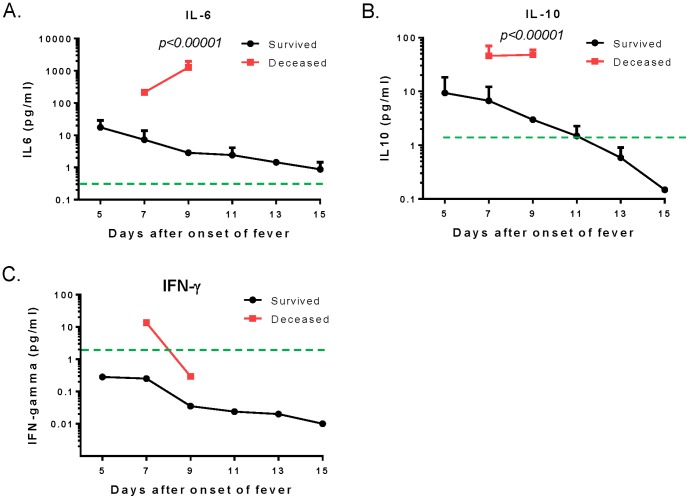
Figure 5. The kinetics of serum IL-6 (A), IL-10 (B), and IFN-γ (C) in SFTSV-infected patients during hospitalization between Day 5 and Day 15 from onset of fever.
In all three graphs, the red and black curves represent the deceased patient group and the survivors, respectively. The values were presented as mean cytokine concentrations with standard errors at each time point. The green dashed line in each graph indicates mean cytokine concentrations in the normal control group. Statistical significance (p<0.05) was indicated between deceased patients and survivors on Day 9 from onset of fever.

