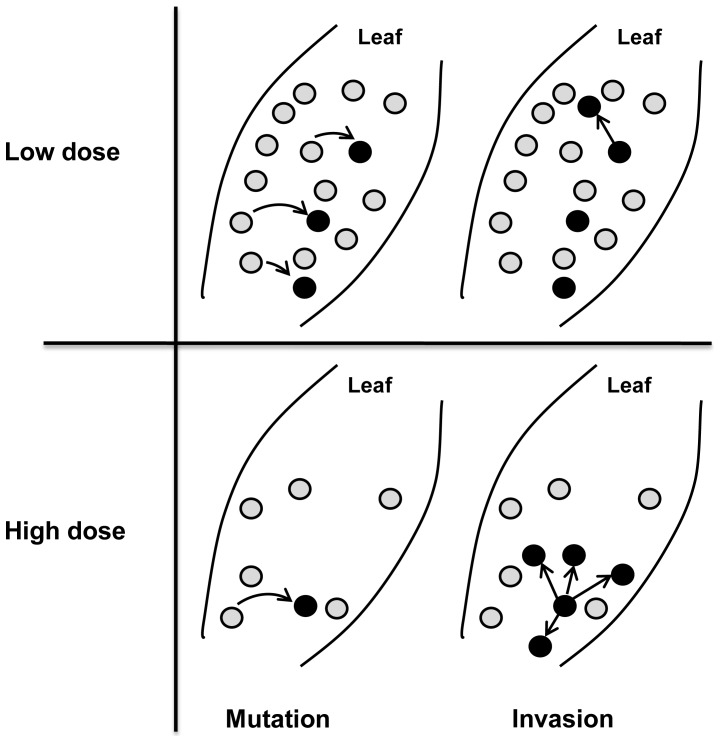
Figure 1. Fungicide dose and resistance emergence.
The effect of the dose rate of a fungicide on the rate at which resistant lesions (black circles) arise through mutation and subsequently invade a sensitive pathogen population (grey circles). Curved arrows in the left subfigures represent mutation events and straight arrows in the right subfigures represent the colonization of new leaf area by the resistant lesions that arose through mutation in the left subfigures. This figure was adapted from figure 8 in [3].

