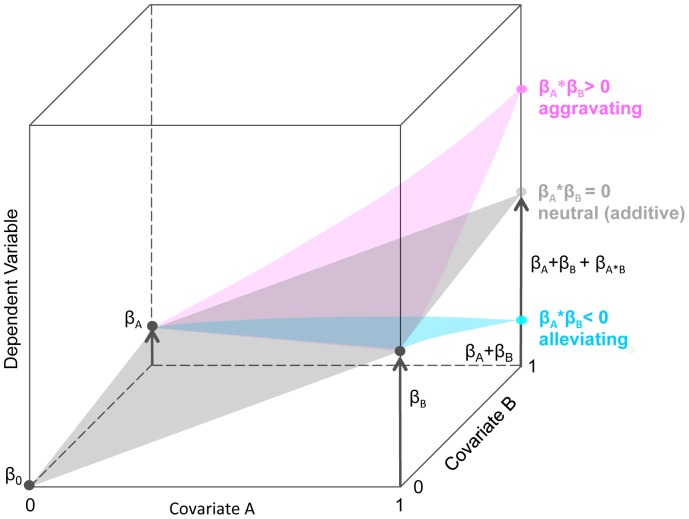
Figure 1. Interaction effects calculated by multiple linear regression.
This schematic visualization of second order linear regression models interaction effects. The diagram of the linear regression model includes two main covariates (strain H and stimulation with Γ) and their interaction covariate H∶Γ. The main covariates can assume two values (H: C57BL/6 or BALB/c; Γ: IFN-γ stimulation or no stimulation). The arrows indicate the estimated effects β. The pink and turquoise arrows reflect the aggravating or alleviating interaction effects as deviations from the additive model. A second order linear model can dissect the effects arising from two perturbations and their interaction by looking at the magnitude and significance of its regression covariates. Most importantly, the interaction covariate can indicate either an alleviating (weaker than expected from the single intervention effects) or aggravating (stronger than expected) interaction. The linear model includes two main covariates H and Γ and their interaction covariate Η∶Γ.

