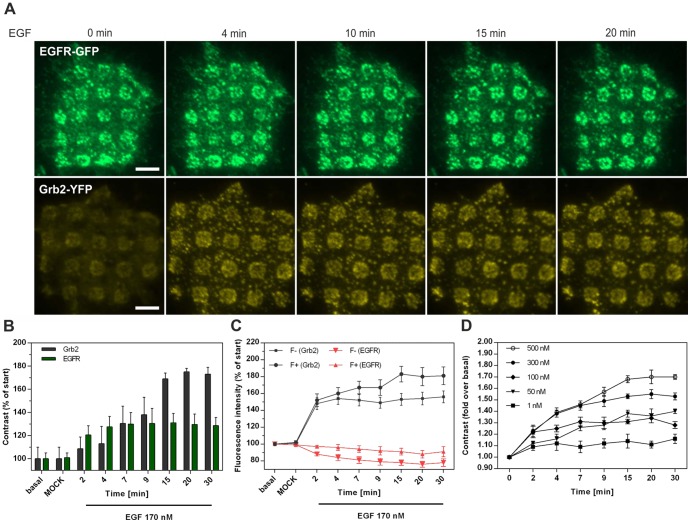
Figure 3. Sensitivity of EGFR-Grb2 interaction on μ-biochips.
(A) HeLa cells expressing EGFR-GFP or Grb2-YFP, respectively, grown on anti-EGFR antibody coated μ-biochips at indicated time points after EGF (170 nM) addition. (B) Temporal resolution of the change in contrast induced by EGF (n = 40 cells). (C) Time course of the corresponding F+ and F- signals of EGFR and Grb2, respectively (n = 40 cells). (D) EGF concentration dependent increase of Grb2 contrast (n = 40). Fluorescent contrast was normalized to the value prior to EGF stimulation. Error bars are based on the standard error of the mean. Scale bar = 5 μm.

