
Figure 6. T cell activation modulates HuR binding towards the hIL-3 ARE-rich region.
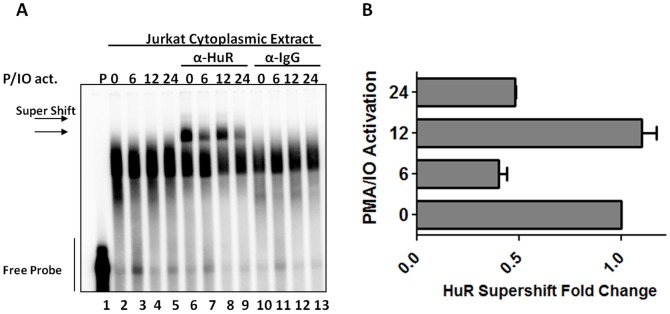
(A) HuR EMSA supershift analysis was carried out with Jurkat cytoplasmic extracts activated at 0, 6, 12 and 24 hours. (B) Graphic representation of HuR supershift quantification during T cell activation. Values represent mean ± standard error of the mean (SEM) from two experiments. Fold changes were normalized to 0 hours of T cell-activation with PMA/Ionomycin.