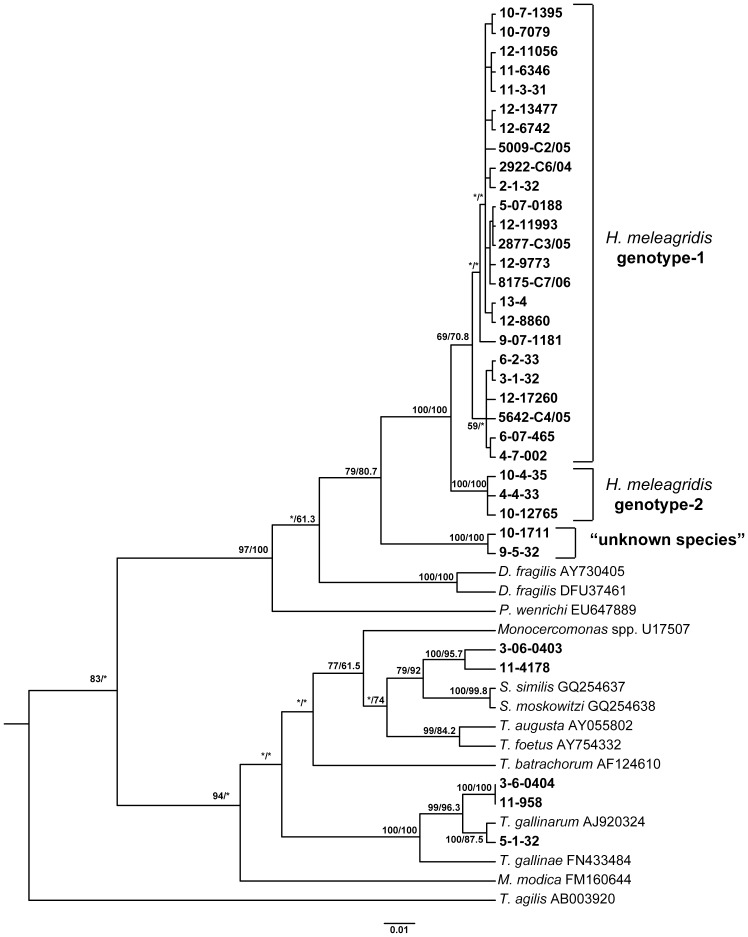
Figure 1. Phylogenetic tree of H. meleagridis isolates based on partial 18S rRNA sequences (approx. 544bp).
For the analysis 47 sequences (sequence types) were used. The phylogenetic analysis was performed by applying separately maximum likelihood and neighbor-joining methods, with Trichonympha agilis as outgroup. The tree generated by maximum likelihood method is shown. Samples (N = 34) originating from this study are labelled bold. The robustness of the tree was determined by bootstrap re-sampling of the multiple–sequence alignments (1000 sets neighbor-joining/100 sets maximum likelihood). Values on the nodes are bootstrap support values indicated as percentages from neighbor-joining and maximum likelihood, respectively. Asterisks indicate nodes with bootstrap values below 50% or with a different topology. Branch lengths are proportional to sequence divergence and can be measured relative to the scale bar shown (bottom right). The scale represents nucleotide substitution per position.

