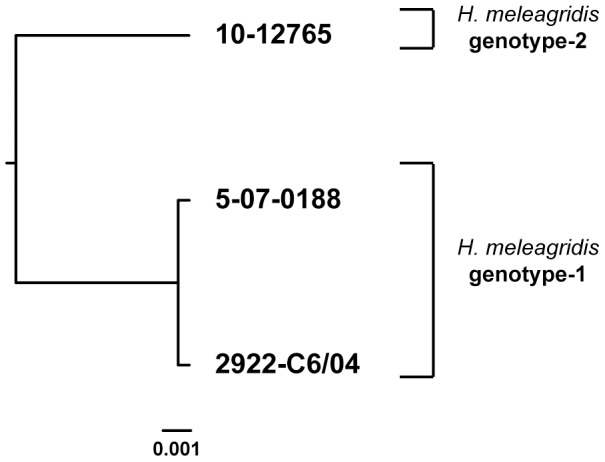
Figure 2. Phylogenetic tree based on partial α-actinin1 sequences of H. meleagridis (approx. 1048bp).

The phylogenetic analysis was performed by applying separately maximum likelihood and neighbor-joining methods. The tree generated by maximum likelihood method is shown. Due to the low amount of analyzed sequences (N = 3) robustness of the tree by bootstrap re-sampling could not be determined. Branch lengths are proportional to sequence divergence and can be measured relative to the scale bar shown (bottom right). The scale represents nucleotide substitution per position.
