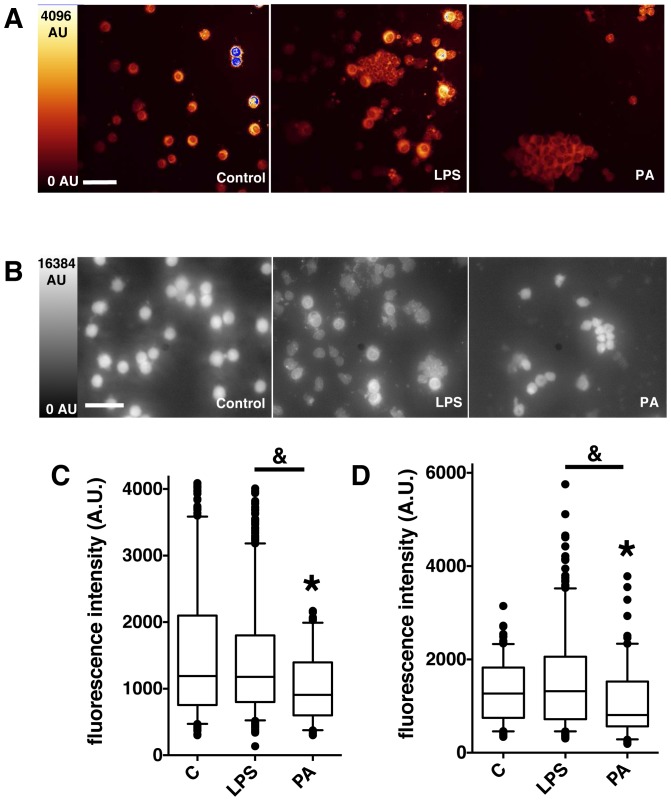
Figure 6. Representative fluorescence intensity images and values in control, LPS-induced acute lung injury and Pseudomonas aeruginosa-induced pneumonia in mice.
Fluorescence intensity imaging by confocal microscopy (A) and standard epifluorescence microscopy (B) of cytospined BAL samples from Control, LPS-induced acute lung injury (LPS) and Pseudomonas aeruginosa-induced pneumonia (PA) in mice. Scale bar, 50 μm. Boxplot representation of fluorescence intensity in arbitrary units (I (AU)) of BAL samples in the 3 different conditions (Control (C), LPS, PA), from confocal images (C) and classical epifluorescence images (D). Boxes represent median (interquartile range). Control group, n = 6, LPS group, n = 7, Pseudomonas aeruginosa group, n = 2. Group comparisons were analyzed by Kruskall-Wallis test with a Mann-Whitney test using Bonferroni's corrections for post-hoc analysis. (C) *: p<10−4 Pseudomonas aeruginosa group versus control group. &: p<10−4 Pseudomonas aeruginosa group versus LPS group. (D) *: p<0.001 Pseudomonas aeruginosa group versus control group. &: p<10−4 Pseudomonas aeruginosa group versus LPS group.

