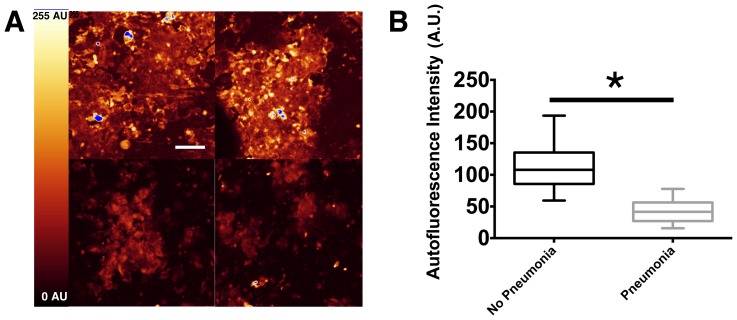
Figure 7. Representative fluorescence intensity images and values in patients with and without VAP.
Nine patients were successively screened. Pneumonia was considered when at least two signs (body temperature >38°C, purulent pulmonary secretions, and leukocytosis >12000/mL or leukopenia <4000/mL) were associated with the appearance of a new infiltrate or changes in an existing infiltrate on chest x-ray. BAL was performed to confirm the diagnosis. The final diagnosis of VAP was based on a clinical pulmonary infection score ≥ 6. A) Representative images of autofluorescence intensities of cytospined BAL from patients without VAP (upper panels) and with VAP (lower panels). Scale bar, 50 μm. B) The results are represented as boxplots of fluorescence intensity to graphically depict the groups of numerical data for each group of patients (n = 169 studied ROI from 2 patients without VAP, n = 551 studied ROI from 7 patients with VAP). Boxes represent median (interquartile range). Student's t-test was used to compare autofluorescence intensity between both groups. *: p<0.0001 VAP patients (pneumonia) versus non-VAP patients (no pneumonia).

