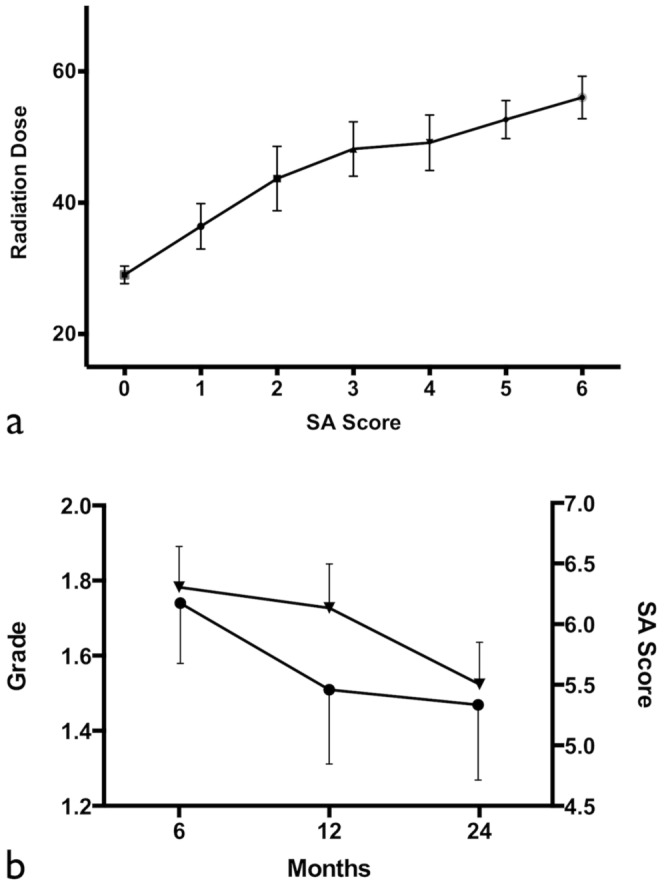
Figure 4. Correlation of SA score with radiation dose and the time trend of trismus development.

(a) Correlation of the received radiation dose of individual masticator structures with their two year SA scores summation (r = 0.48, p<0.0001). (b) Evolution of the SA scores and the trismus grade over time. Gradual decrease of trismus severity grade (▾) and SA scores (□) is noted within 24 months.
