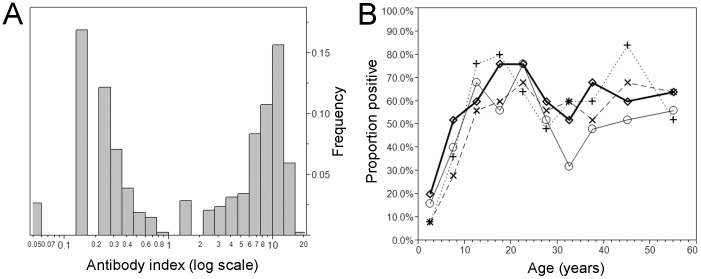
Figure 1. Distribution of the IgG antibody index and the time- and age-dependent proportion seropositive against parvovirus B19 in Japan from 2004-07.
A. The distribution of IgG antibody index against parvovirus B19. The antibody index was calculated as the ratio of the optical density of test sample to that of control. Using a logarithmic scale for the horizontal axis, a bimodal shape is clearly identified. B. The time- and age-dependent proportion of seropositive against parvovirus B19. The collection of serum samples took place in 2004 (unfilled circles with thin solid line), 2005 (crosses with dotted line), 2006 (diamonds with thick solid line) and 2007 (x marks with dashed line), respectively.

