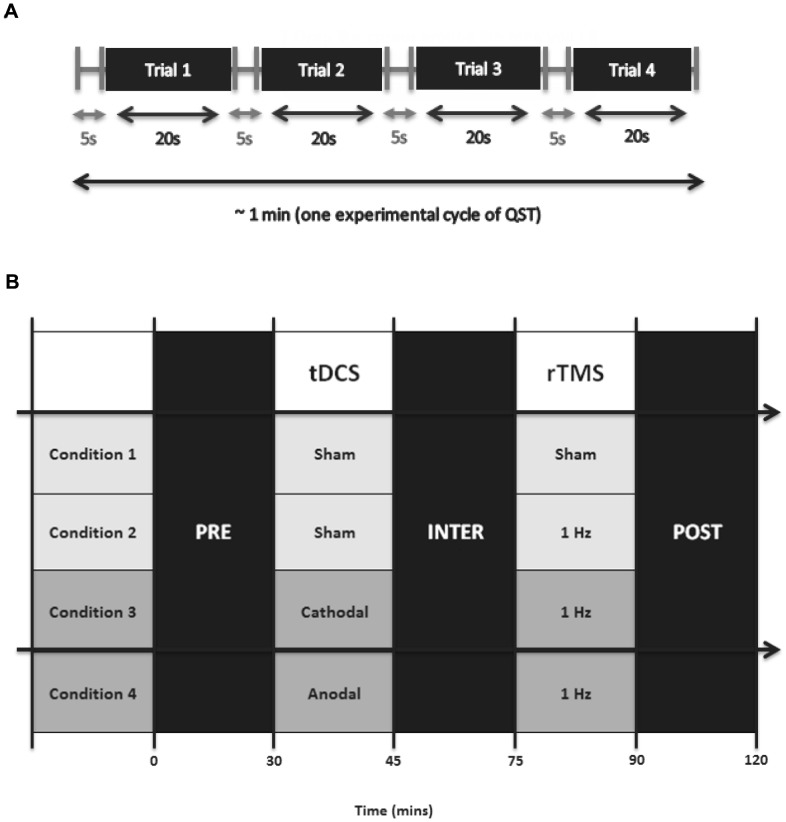
Figure 2. Experimental Approach.
Panel A illustrates one cycle of pressure pain threshold (PPT) measurement using quantitative sensory testing (QST). Panel B depicts the timeline of the experimental sessions over the testing period. Experiments were conducted on the same day at the same time, every week, for experimental accuracy in data collection.

