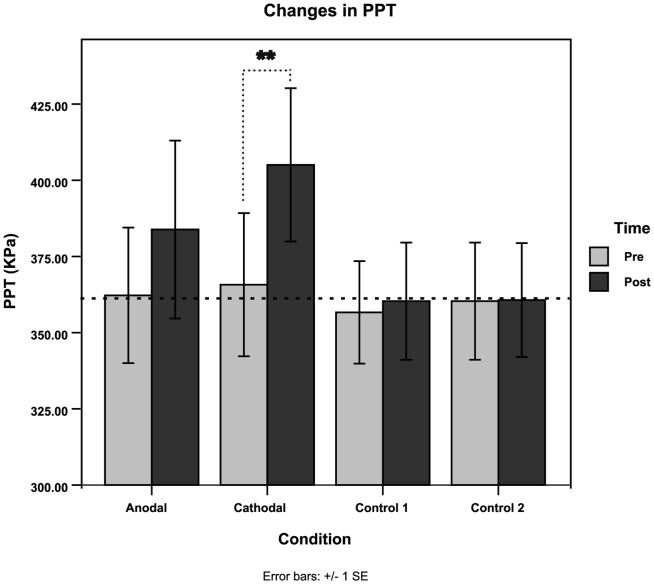
Figure 3. Changes in Pressure Pain Thresholds (PPT).
Raw pressure pain thresholds (PPT) averaged and presented across all conditions, prior to stimulation (PRE) and immediately after stimulation (POST). Dotted line represents the average baseline of PPTs across all participants ∼361.25 KPa. (*Denotes significance, **p<0.01 within the 4x2 ANOVA as a main effect of the factor Condition)

