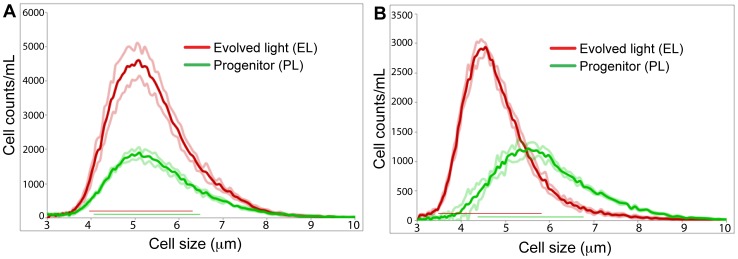
Figure 2. The distribution of cell sizes of exponential (A) and stationary phase (B) cultures of the PL (green line) and EL (red line) C. reinhardtii populations used in our analysis.
The size at one standard deviation from the mean for each cell population is shown with the light colored lines. Although a broad range of cell sizes is present in each culture, the stationary phase EL population is on average ca. 1 μm smaller than the PL cells.

