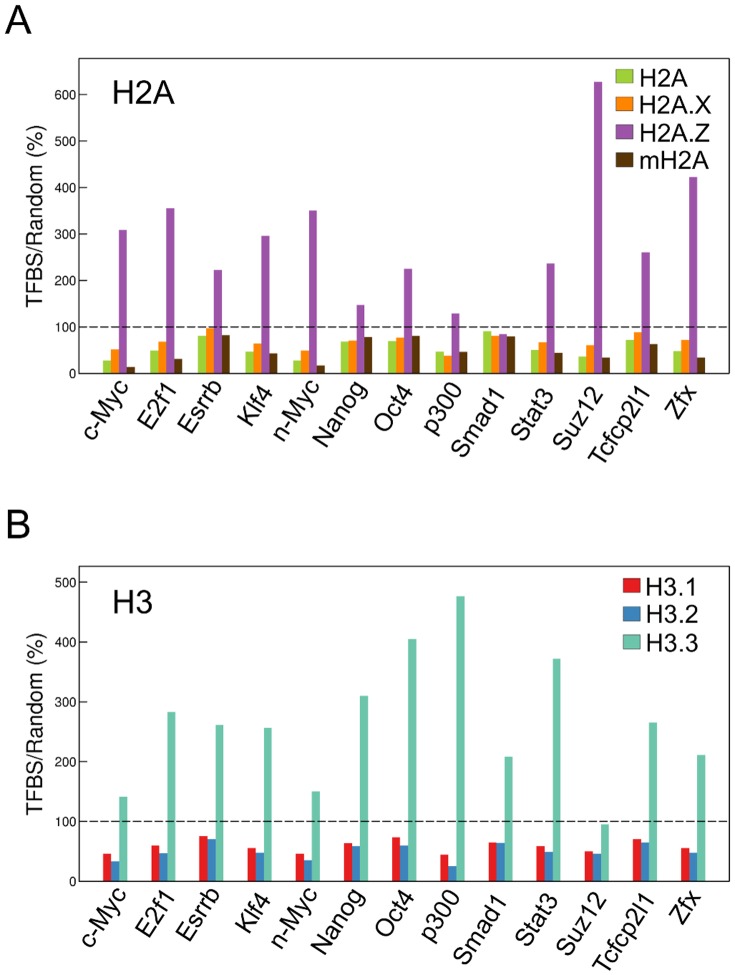
Figure 3. Enrichment of histone variants in enhancer regions.
Bars represent the ratios (%) of enrichment of the histone H2A (A) and H3 (B) variants ±200 bp from the center of the transcription factor binding site (TFBS) as defined using Chen's TF ChIPseq data [35] to the average enrichment in 5,000 400-bp regions randomly selected from the whole genome, excluding TFBSs. The dotted line indicates 100%, representing the average value of the enrichment in randomly selected regions.

