
Figure 5. Enrichment of histone variants in CpG islands (CGIs).
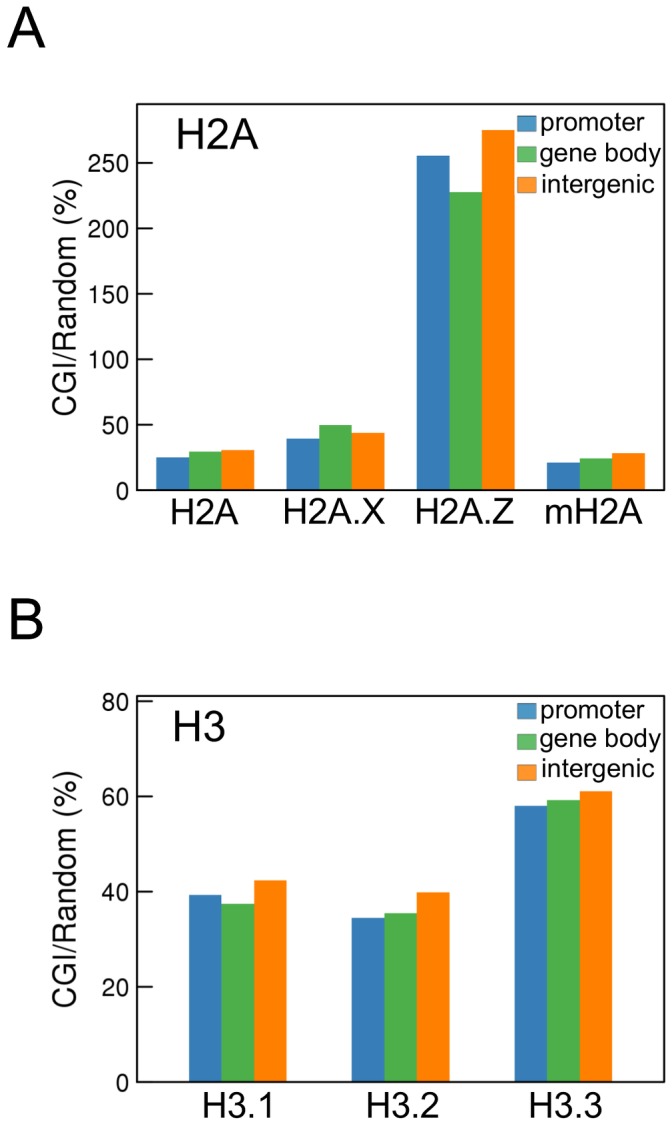
The enrichment of histone H2A (A) and H3 (B) variants in CGIs defined in the UCSC Genome Bioinformatics Site was determined in promoters (blue), gene bodies (green), and intergenic regions (orange). The ratios (%) of the enrichment in CGIs to the averaged enrichment in 5,000 randomly selected 656-bp regions, which is the average length of all CGIs analyzed, from the whole genome excluding CGIs were calculated.