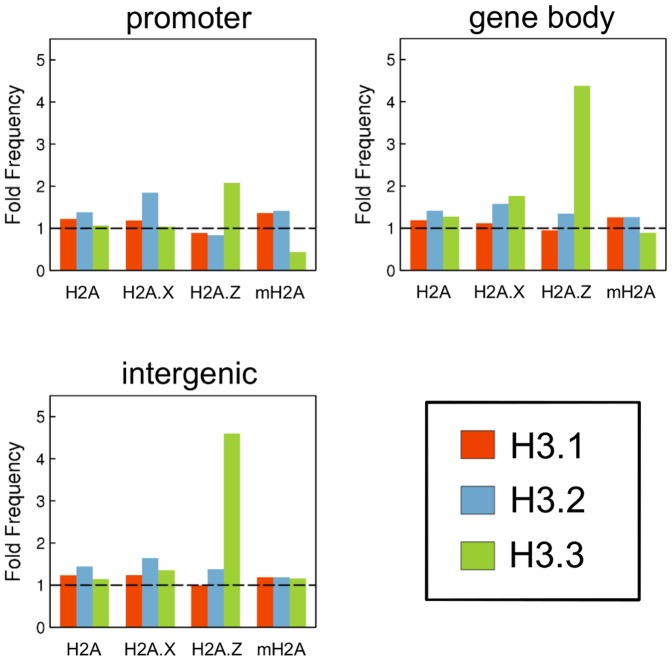
Figure 7. Preferred combination of H2A and H3 variants in various genome regions.
The genome was divided into 150 nucleotide bins, and the bins in which a particular variant was significantly enriched were determined as described in the Materials and Methods (see Figure S4). The frequency of bins in which two H2A and H3 variants were simultaneously enriched was determined for all combinations of H2A and H3 variants. Bars represent the ratios of the frequencies determined as described above to those of the expected values calculated from the number of bins in which each variant was enriched. Therefore, values >1.0 indicate a preference for that particular H2A and H3 variant combination.

