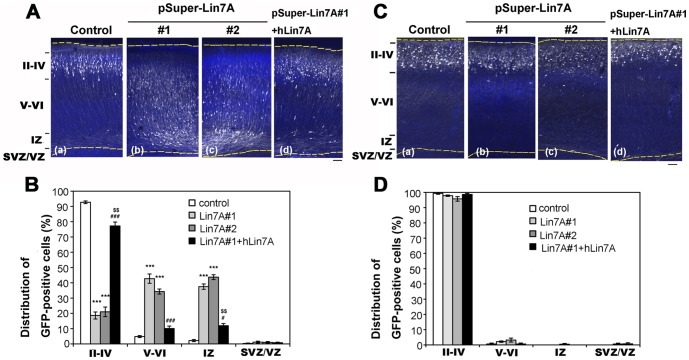
Figure 5. Role of Lin-7A in neuronal migration during corticogenesis.
(A) and (C), pCAG-EGFP was co-electroporated with (a) pSUPER vector (Control), (b) pSUPER–mLin7A#1, or (c) pSUPER–mLin7A#2 into cerebral cortices at E14.5, and fixed at P2 (A) or P7 (C). Coronal sections were prepared and immunostained with polyclonal anti-GFP (white). Nuclei were stained with DAPI (blue). (A, d) Rescue of pSUPER–mLin7A#1-induced migration defects. pSUPER-mLin7A#1 was electroporated with pCAG-GFP and pCAG-Myc-hLin-7A into cerebral cortices at E14.5, followed by fixation at P2. Analyses were performed as described above. Bar, 100 μm. (B) and (D), Quantification of the distribution of GFP-positive cells in distinct regions of the cerebral cortex for each condition shown in A (B) and C (D). Values indicate the mean ± S.E.M. n = 3 each. ***P<0.001 vs. Control (Fisher's LSD test); # P<0.05, ### P<0.001 vs. Lin7A#1 (Fisher's LSD test); $$ P<0.01 vs. Control (Fisher's LSD test).

