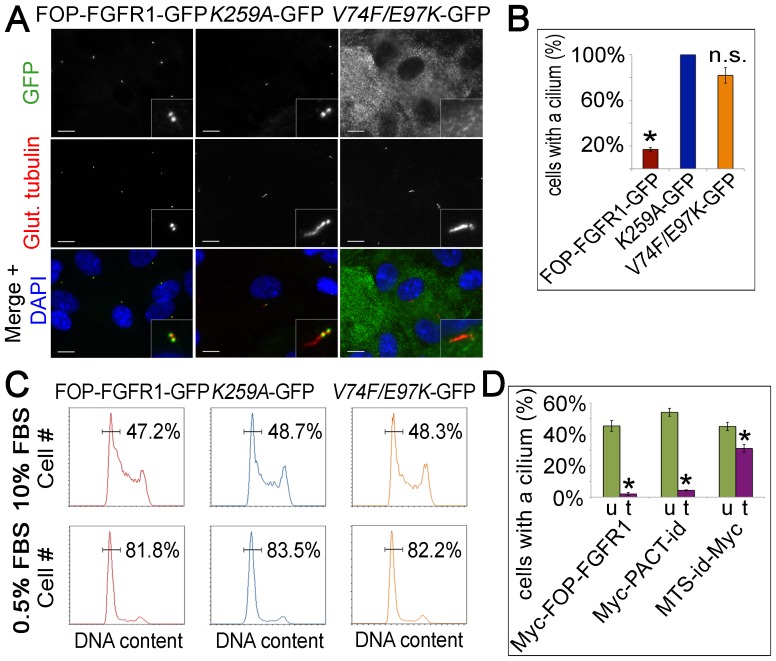
Figure 4. MPN fusion expression causes a decrease in ciliogenesis.
(A) RPE-1 cells stably expressing FOP-FGFR1-GFP, Myc-FOP-FGFR1K259A-GFP, or Myc-FOP-FGFR1V74F/E97K-GFP, serum-starved for 48 h, fixed, and stained with antibodies against GFP (green) and glutamylated-tubulin (red). DNA is stained using DAPI (blue). Scale bars: 10 μm; insets: 5× magnification. (B) Graph showing percent of FOP-FGFR1-GFP and mutant expressing cells that form a primary cilium normalized to FOP-FGFR1K259A-GFP. Bars represent mean of three independent trials ± SEM. *p<0.05, n.s. p>0.05. (C) Percentage of GFP-positive cells with G0/G1 DNA content following 48 h incubation in complete or low serum medium. N = 10,000 cells each. (D) Graph showing percent of transfected (t) Myc-FOP-FGFR1, Myc-PACT-idFGFR1, and MTS-idFGFR1-Myc expressing cells that form a primary cilium compared to neighboring untransfected (u) cells following 48 h incubation in low serum medium containing dimerization ligand. Bars represent mean of technical triplicates ± SEM. *p<0.05.

