
Figure 1. Example of syllable labeling and schematic drawing of the semi-automated labeling procedure.
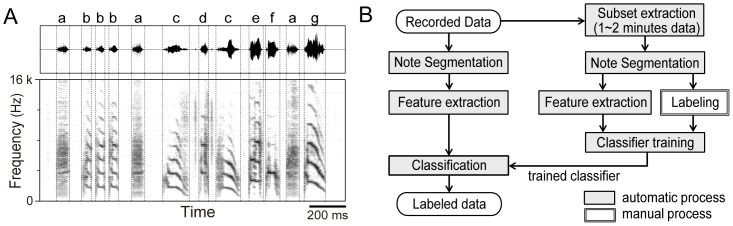
(A) Waveform and spectrogram of a typical Bengalese finch song. Label examples are shown above the waveform panel. Boundaries of syllables and gaps are indicated as dotted vertical lines. (B) Proposed procedure for semi-automated labeling. Stages in gray boxes are automatically processed, and a white box indicates manual processing stage.