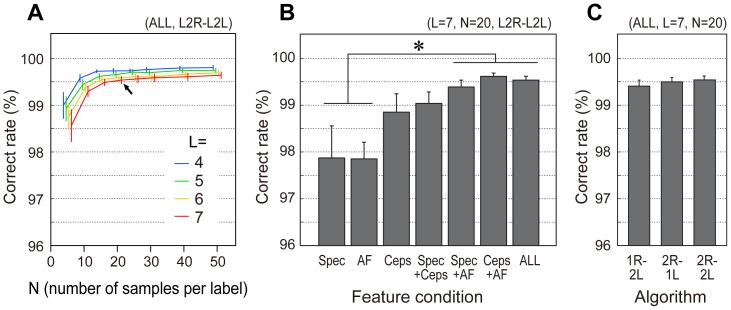
Figure 2. Cross validation performances of classification in ideal dataset situation (Evaluation 1).
The correct rates (%) were derived with systematically varying number of labels (L), number of samples per label (N), feature conditions, and optimization algorithms. (A) Correct rates of each of label number conditions (differentiated by line colors) as a function of sample number conditions for ALL-feature and 2R–2L-optimization situation. (B) Correct rates at L = 7, N = 20 location (shown as a black arrow in the leftmost panel) as a function of feature conditions using 2R–2L optimization. (C) Correct rates L = 7, N = 20 location from different optimization functions. Error bars indicate standard error (n = 8 birds). *p<0.05 (Tukey-Kramer HSD).

