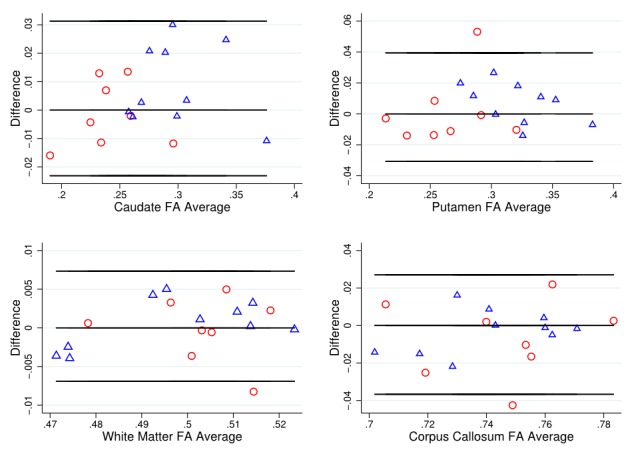
Bland-Altman plot for FA values.

Bland Altman plots of fractional anisotropy (FA) values to visually assess agreement, systematic bias and proportional bias in scanning technique for T1 ROIs (caudate, putamen, white matter and corpus callosum), for early HD patients (blue triangles) and controls (red circles). FA is a relative value derived from the diffusion tensor, where 0 indicates perfectly isotropic tensor dimensions (i.e. a sphere) and 1 indicates the maximum theoretical level of anisotropy.
